
Table of Contents
Most intraday traders have felt the specific sting of chasing a gap at the open. You see a stock rip, the fear of missing out takes over, and you hit the buy button—only to watch the trade immediately reverse. These mistakes often look smart in the moment, yet they quietly drain accounts over months. However, the solution isn't necessarily to trade more or learn complex new setups. It is about waiting for better information.
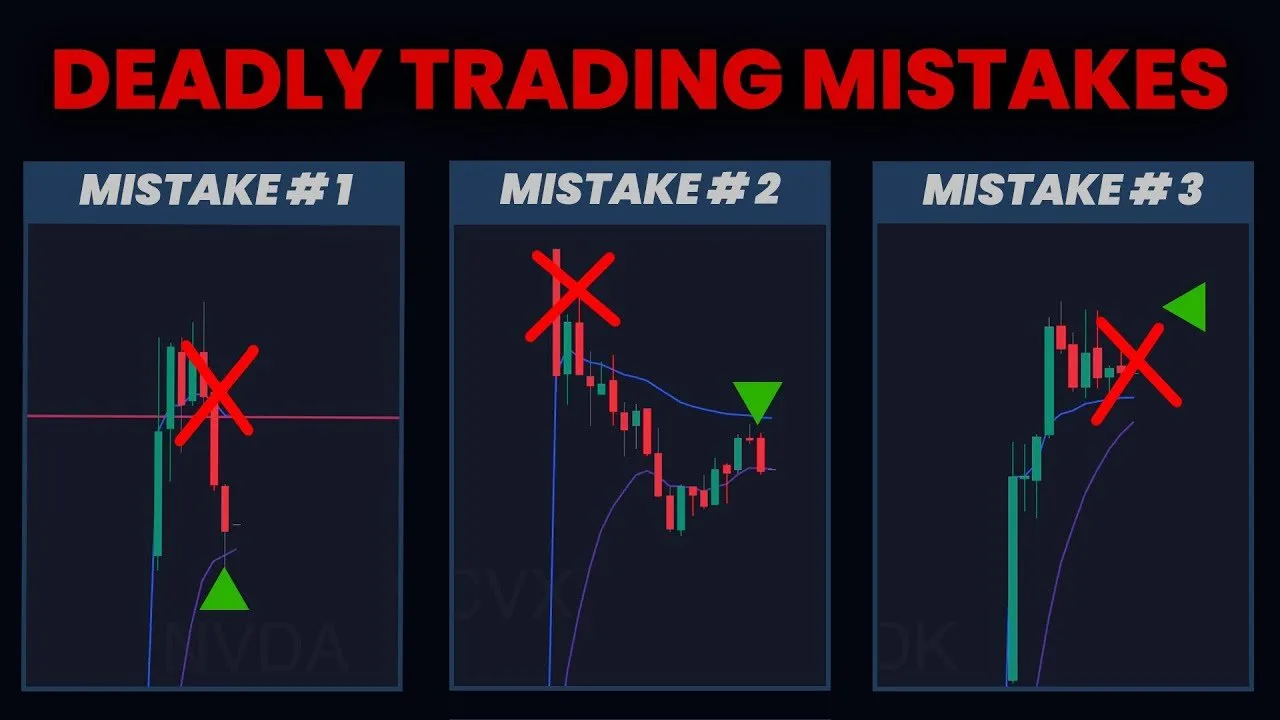
Successful gap trading requires a shift in perspective. Instead of viewing early movement as a signal to act, profitable traders view it as data to analyze. By identifying specific traps—from low-volume air pockets to exhaustion drives—you can transform impulsive losses into calculated winners.
Key Takeaways
- Urgency is a warning sign: The impulse to enter a trade immediately at the open is often a signal to wait for a confirmed pullback or support hold.
- Context overrides the 1-minute chart: A gap up means little if it opens directly into significant daily resistance or lacks volume.
- Strength is often quiet: Genuine momentum frequently manifests as tight consolidation and the refusal to give back ground, rather than explosive volatility.
- VWAP is the consensus: Using the Volume Weighted Average Price as a line of defense rather than just a target helps distinguish between trend days and chop.
The Trap of Urgency and Context
One of the most expensive habits in trading is the need to be first. Many traders equate speed with opportunity, believing that every second they wait is money slipping through their hands. This mindset creates specific, avoidable traps that rely on emotional urgency rather than market structure.
The Immediate Gap and Fail
This is the classic "chaser trap." When a stock gaps up and sprints immediately off the open, the natural instinct is to get involved before it runs away. However, reacting to movement rather than strength is a fundamental error. When a stock moves too fast without establishing support, it is prone to an immediate fade.
Professional traders reframe this urgency. Instead of a signal to buy, fast movement acts as a warning to slow down. The goal changes from taking the shot to acquiring the target. By waiting for the first pullback or for price to rest, you determine if the move is real. If the stock stalls and fades, you avoided a loss. If it holds above a key support area, you have a defined entry with clear risk.
Zooming Out: The Resistance Blind Spot
A stock might look unstoppable on a one-minute chart, gapping up 5% with strong green candles. Yet, traders often fail to zoom out to the daily timeframe. If a stock opens directly into a historical supply zone—a price level that has rejected the stock for weeks or months—the gap is not a catalyst for a breakout; it is an invitation for negotiation.
What once felt like random rejection now sets up a predictable location trade. He’s on the fence... expecting, rightfully so, negotiation.
When price pushes into higher timeframe resistance, do not expect immediate continuation. Prepare for the move to fail or consolidate. The trade here is not to blindly buy the gap, but to wait and see if the market can chew through that supply or if sellers will step in once again.
Mistaking Speed for Control
There is a distinct difference between speed and control. An "opening drive" where buyers aggressively hit offers can look bullish, but if no one defends the price afterward, it is simply exhaustion. Real strength tends to slow down and base before continuing. Fake strength burns itself out in a vertical move.
If you see an opening drive that tries to press higher repeatedly but fails to base out, prepare for an exhaustion fade. The buyers who chased the price up are left without support underneath them, creating an air pocket that sellers will exploit to walk the price back down.
Validating the Gap with Volume and Trend
Not all gaps are created equal. Some are genuine shifts in value, while others are simply low-volume "air pockets" that will be filled immediately. Distinguishing between the two requires analyzing participation and trend alignment.
The Volume Rule and Trend Alignment
A gap without volume is a trap. If a stock gaps up but doesn't trade significant volume, it implies a lack of institutional interest. A practical metric to validate a gap is the 3% rule: if the stock hasn't traded at least 3% of its average daily volume on the gap, treat it with extreme caution.
Furthermore, you must assess the pre-market trend. If a stock gaps up on news but has been drifting lower since the 4:00 AM open, do not fight the trend. The market participants who have had hours to digest the news are selling. A gap up in a pre-market downtrend often leads to a "death by a thousand cuts" for buyers trying to catch a bottom. In these cases, the high-probability trade is often a scalp short against the opening range, provided there is room to the next support level.
When VWAP Becomes the Verdict
The Volume Weighted Average Price (VWAP) is not magic; it represents the consensus of where value lies for the average participant. Early in a trader's career, VWAP might seem like just another line on the chart. In reality, it is the dividing line between buyer and seller control.
If a breakout fails and the price loses VWAP, hope should be replaced by action. When price sustains below this level, it indicates that the average participant is underwater and sellers are in control. Conversely, in a strong trend, VWAP acts as a floor. Recognizing this allows you to stop hoping for a reversal and start aligning with the dominant side of the market.
Volatility Storage and Compression
Traders often fear boredom, assuming that a lack of movement means a lack of opportunity. This leads to missing the "tight consolidation" setup. When a stock enters a tight range with shrinking volume, volatility isn't disappearing—it is being stored.
Watch for volume compression. If the range is tight and volume is drying up, the stock is building energy. The signal to enter is when volume begins to expand again (aim for a 50% increase in volume bar size) as the price breaks the range. This "boredom" is often the precursor to the day's most explosive move.
Recognizing Hidden Signs of Strength
The best trades often don't announce themselves with fireworks immediately. They require reading the tape to see what is happening beneath the surface price action.
The High and Tight Flag
Many traders lose confidence when a stock gaps up and then chops sideways. They interpret this stillness as weakness. However, if a stock is sitting near its highs and refusing to give back ground, it is displaying immense strength. This is the "High and Tight Flag."
Real strength slows down before it continues. Fake strength just completely burns itself out.
In this scenario, sellers are attempting to push the price down, but every pullback is shallow and met with absorption. The stock isn't resting because it's weak; it's resting because buyers are dominant. Instead of getting bored, focus on the tape. The quietest periods often precede the loudest breakouts.
The Power of Defense (Trend Days)
Trend days are elusive because traders often chase the highs, get stopped out on pullbacks, and miss the larger move. The key to capturing a trend day is not buying the breakout, but buying the defense.
On a true trend day, pullbacks will repeatedly respect VWAP. Sellers may push price down, but buyers will absorb the supply at the average price and lift it again. Once you recognize this pattern of defense—where the stock "pukes" to VWAP and holds—stop trying to predict the next five minutes. Shift your thinking from "scalp" to "campaign," using the repeated defense as confirmation to hold for a larger move.
Failed Flushes and Absorption
Weakness can be deceptive. A "failed flush" occurs when a stock drops aggressively, perhaps breaking a key level, but immediately snaps back above it with force. This move is designed to clear the field of weak hands. When price reclaims a key level (like VWAP) after a flush, it triggers a rush of buyers chasing the stock back up.
Similarly, look for absorption at the highs. This is a tape-reading nuance where massive sell orders hit the time and sales, yet the price does not tick down. This indicates an "iceberg" buyer—a participant with a large order absorbing all liquidity. When heavy selling fails to move price lower, it signals that the path of least resistance is up.
Conclusion
The transition from a struggling trader to a consistent one is rarely about being more aggressive. It is about being more selective. The traders who successfully navigate gaps have stopped reacting to every price tick and started waiting for specific information: the volume profile, the reaction at resistance, and the defense of key levels.
Your Profit and Loss statement isn't defined by how many trades you take, but by the quality of the setups you accept. By recognizing when urgency is a warning and when stillness is strength, you stop fighting the market and start letting the price action dictate your strategy.


)