
Table of Contents
One of the most persistent paradoxes in trading is that the traders who grow the fastest often do so by subtracting complexity rather than adding it. They don't struggle because they lack intelligence or drive; they struggle because complex strategies fall apart under the pressure of real-time decision-making. When a strategy requires too many variables to align, hesitation sets in, and good decisions are overridden by noise.
The solution lies in understanding what the market actually remembers. Price action is not random; it is a historical record of where buyers and sellers made significant commitments. By leveraging a concept known as the "Market Memory Model," traders can stop chasing random movements and start capitalizing on areas where institutions are forced to defend their positions. This approach isn't about predicting the future—it is about respecting the documented decisions of the past to build a repeatable, consistent edge.
Key Takeaways
- Focus on "Day Two" Names: Apply this strategy to stocks that had a significant catalyst or massive range expansion the prior day, ensuring realized volatility and institutional presence.
- Map "Documented Decisions": Support and resistance lines shouldn't be arbitrary; they must represent yesterday’s high, low, and the specific intraday level where a significant battle occurred.
- Avoid the Middle: Market memory is weakest in the center of the range. High-probability trades occur at the extremes where buyers or sellers previously stepped in with conviction.
- Wait for the "John Wick" Candle: Utilize this distinct rejection candle pattern to confirm that the algorithmic "buy" or "sell" programs have reactivated at key levels.
The Psychology Behind Market Memory
To execute this strategy effectively, you must understand why it works. Many traders view support and resistance lines as mere technical suggestions. However, in the Market Memory Model, these lines represent documented decisions. The top of a range represents the price point where the largest collective seller stepped in and said, "No more." The bottom represents where real money stepped in to defend the valuation.
These are not opinions; they are financial footprints. When price returns to these levels the following day, reactions occur not because of magic, but because institutions and algorithms are programmed to respond to familiar prices. The market is essentially auctioning between remembered extremes.
Markets remember where real buying and selling happened. So when we have those intraday levels... it often reacts again not because of magic but because people, institutions, and algorithms respond to familiar prices.
The traders who succeed are those who stop trying to predict where the price might go and start reacting to where the price must react based on previous volume and commitment.
Constructing the Framework: The Setup
The Market Memory Model is most effective when applied to specific stocks under specific conditions. It is not designed for low-volatility names chopping sideways. It requires a "Day Two" structure.
Finding Day Two Names
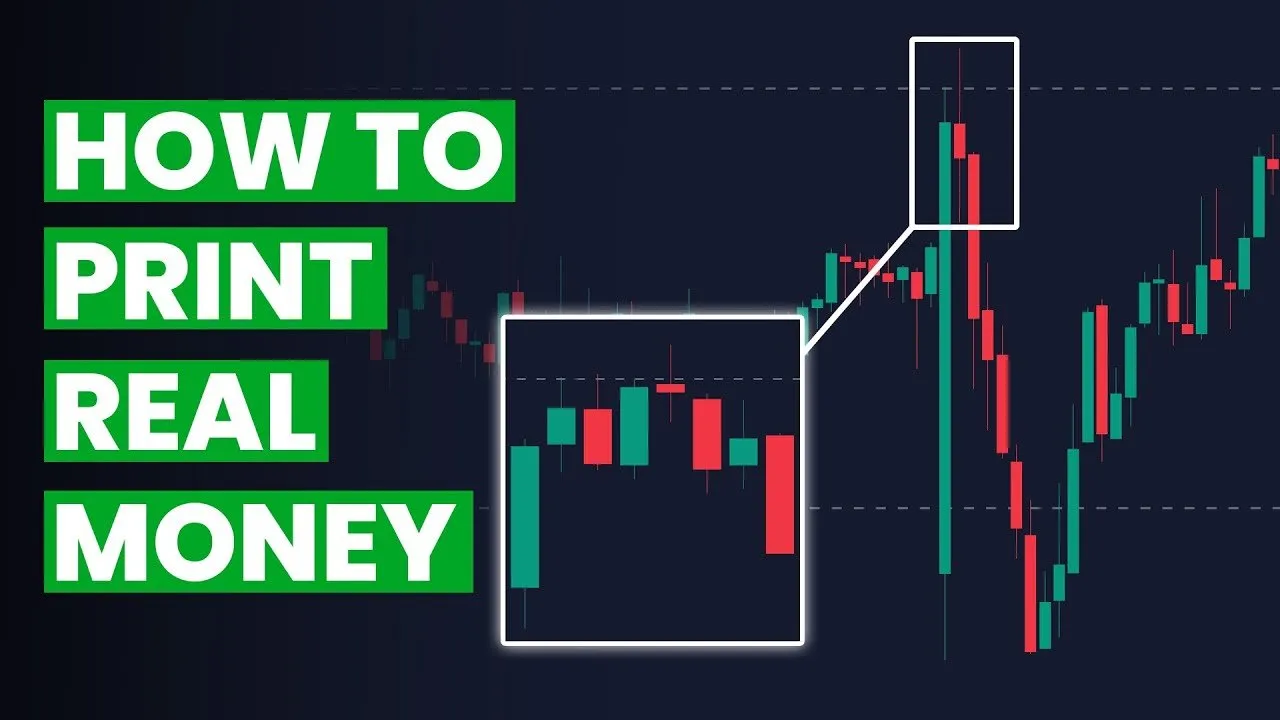
A "Day Two" name is a stock that made a significant, catalyst-driven move in the prior session. This catalyst could be a news story, an earnings release, or a technical break of a major range. The key is that a large green or red candle was formed on the daily chart.
Why is this important? A massive move implies that large players are trapped, committed, or forced to manage positions. When these players are active, the technical levels become far more respectful than in a stock with low participation.
Drawing the Battle Lines
Once a Day Two candidate is identified, you must prepare the chart before the market opens. This process involves drawing three specific lines based on the prior day’s price action:
- Yesterday’s High: The point where sellers aggressively capped the price.
- Yesterday’s Low: The point where buyers established a floor.
- The Intraday Battleground: This is the most nuanced line. Look for a level inside the previous day's range where price struggled significantly. This could be a level the stock got above and never fell back below, or a level it rejected and never reclaimed.
You do not need a chart cluttered with indicators. You need three to four lines that tell the story of where money changed hands.
Execution Rules: "Don't Diddle in the Middle"
A common mistake developing traders make is engaging with the stock regardless of its location within the range. The Market Memory Model dictates a strict rule: avoid the middle.
The center of the range is where market memory is the weakest. In this zone, the structure is unclear, and the price is often just noise traveling between the real decision points. Trading here invites emotional errors and "FOMO" (Fear Of Missing Out).
- If price opens near yesterday's high: Do not buy immediately. Look for failure or a sustained hold. Buying into resistance without confirmation is gambling.
- If price opens near yesterday's low: Do not sell immediately. You are shorting into the hands of yesterday's aggressive buyers.
The goal is to wait for the price to test the edges. Experience shows that the scariest trades often produce the best results. When a stock is plummeting toward support, your instinct screams "falling knife," but the model says "memory test."
The scariest prices often have the strongest memory. The buyers who aggressively defended this level yesterday twice didn't just disappear overnight.
The Entry Trigger: The John Wick Candle
Identifying the level is only half the battle; knowing exactly when to enter is the other. The specific trigger used in this model is referred to as the "John Wick" candle. This is a distinct reversal candle that signals a sudden shift in control—effectively, the moment the "buys" or "sells" are activated with lethal precision.
identifying the Candle
A John Wick candle occurs right at a key memory level (yesterday's high, low, or battleground line). It is characterized by:
- A long wick: Showing a rejection of higher or lower prices.
- A strong close: The candle closes near the opposite end of the wick, indicating one side has taken total control.
- Immediate follow-through: The subsequent price action confirms the rejection.
For example, if a stock runs up to yesterday’s high, spikes through it, but then slams back down to close near its low, that is a bearish John Wick candle. It signifies that the sellers from yesterday have stepped back into the room.
Trade Management
Once the signal candle forms, the trade management becomes mechanical, removing the need for emotional guessing:
- Entry: Taken on the break of the John Wick candle in the direction of the reversal.
- Stop Loss: Placed just beyond the wick of the signal candle. If the market violates this memory level, the thesis is wrong.
- Target: The price will naturally auction toward the other side of the range. If you short resistance, your target is the support (or VWAP as an intermediary).
Handling Breakouts and Structure Shifts
What happens if the price breaks through a level and holds? The Market Memory Model adapts. If a stock pushes above yesterday’s high and refuses to fail—holding that level as new support—the memory has shifted.
In this scenario, you wait for the retest. If the price comes back to the breakout level and forms a bullish John Wick candle (rejecting the downside), the previous ceiling has become a floor. This confirms that a new memory is forming, and you can trade in the direction of the new trend.
Conversely, later in the day (specifically after 12:00 PM), traders should watch for "backside" trades. If a stock has tried repeatedly to break a high and failed, putting in lower highs, the buyers will eventually exhaust themselves. When the structure finally breaks, the move back to the lows is often rapid as panicked longs exit simultaneously.
Conclusion
The Market Memory Model provides a remedy for the anxiety that plagues inconsistent traders. By stripping away complex indicators and focusing on the raw auction process—Highs, Lows, and Decision Points—trading becomes a test of patience rather than a test of prediction.
The goal is not to trade every move, but to wait for the price to interact with a level where you know real business was conducted previously. When you combine documented levels with a specific trigger like the John Wick candle, you stop fighting the market and start aligning with the institutions that move it. Simplicity in strategy leads to clarity in execution, and clarity is the foundation of consistency.


