
Table of Contents
After a hiatus involving a move to New Zealand and settling into fatherhood, the "Return of the Duck" livestream is back. The cryptocurrency market has been trading sideways for months, but recent price action suggests we are approaching a critical decision point. While the monthly timeframes urge caution at major resistance levels, the weekly charts are beginning to paint a more optimistic picture of a potential reversal.
In this session, we dissect the divergence between high-timeframe charts, the persistent struggle of the altcoin market due to liquidity dilution, and the necessary psychology required to trade breakouts effectively. Whether you are managing underwater positions or looking for new entries, understanding the current market structure is vital.
Key Takeaways
- Weekly vs. Monthly Divergence: Bitcoin faces stiff resistance on the monthly chart, but the weekly timeframe is showing strong signs of a bullish reversal and range reclaim.
- The Altcoin Liquidity Trap: An oversupply of new tokens is diluting the market, causing most altcoins to bleed against Bitcoin despite USD gains.
- Execution Psychology: Trading requires making "hard choices"—buying uncomfortable breakouts or cutting losses on stagnant assets to preserve capital.
- Asset Specifics: While the broader altcoin market is weak, specific assets like Monero (XMR) and Solana (SOL) show constructive technical setups.
Bitcoin Technical Analysis: A Tale of Two Timeframes
The current market structure presents a conflict between the monthly and weekly views. This divergence requires traders to balance high-timeframe caution with intermediate-term bullish momentum.
The Monthly Resistance
On the monthly chart, Bitcoin is trading directly at a major resistance level. Historically, buying into such resistance is risky. The chart has not yet confirmed a breakout, and until a clean monthly close occurs above this zone, the risk of a rejection remains valid. However, looking at resistance alone can be deceptive if the lower timeframes are signaling strength.
The monthly time frame is to me at the only real resistance that matters... It looks quite dangerous to get overly bullish here, but I do understand why people are getting more bullish on the lower time frames.
The Weekly Reversal
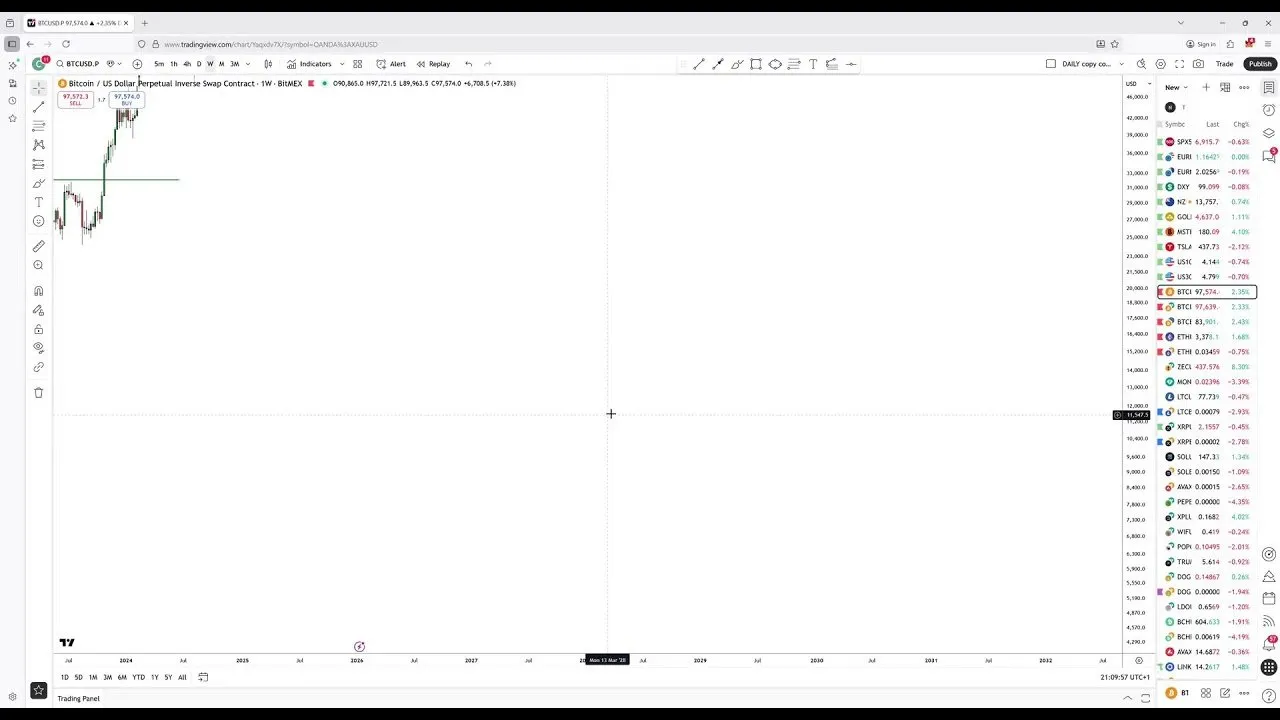
Conversely, the weekly chart is providing the most compelling evidence for a bullish continuation. After breaking down from the range highs, Bitcoin found support and has slowly ground its way back up. Notably, the price has reclaimed the breakdown level. In technical analysis, when an asset reclaims a breakdown level, it often signals that the initial move down was a "bear trap," leading to a squeeze upward.
If Bitcoin can close the week strong, it validates a reversal setup. The target for this momentum would likely be the 104,000 to 105,000 region. While a pullback is always possible, the fact that price has returned to these highs after a breakdown is inherently bullish. Bearish structures typically test resistance and reject immediately; they rarely round out and reclaim the range as Bitcoin is doing now.
The State of Altcoins: Dilution and Decay
A recurring theme in the current cycle is the underperformance of altcoins relative to Bitcoin. While select memes or specific narratives may pop, the broader altcoin market is suffering from a fundamental liquidity issue: there are simply too many coins.
The Dilution Problem
Every new token launch dilutes the available liquidity for existing assets. This acceleration of supply, exacerbated by platforms like pump.fun, means that capital is spread too thin to sustain broad market rallies. Consequently, holding altcoins for long periods has become a dangerous strategy. Many assets from previous cycles are bleeding slowly against Bitcoin, even if their USD value remains stable.
The problem with the altcoins is that there's just too many of them... when you just make new coins, you take liquidity away from older ones. And the more coins you get, the worse it gets for everyone.
Notable Altcoin Charts
Despite the gloom in the general altcoin sector, a few charts stand out:
- Monero (XMR): This asset is showing significant strength. The weekly chart resembles the breakout structure of Gold or ZCash prior to major runs. It has broken multi-year resistance and appears to have room to run, driven partly by a rotation of capital from other privacy coins.
- Solana (SOL): Solana remains one of the more resilient assets. It held its monthly support despite broad market volatility. While it isn't confirming a massive breakout yet, the fact that it refused to break down alongside weaker alts is a sign of relative strength.
- Litecoin & XRP: These legacy coins are often traded on narratives like "Bitcoin Silver," but the technicals are mixed. They may perform well simply due to beta exposure if the entire market lifts, but they lack the distinct structural strength seen in Monero.
Trading Psychology: Mastering the Hard Choices
Successful trading is rarely about finding an easy setup; it is about managing discomfort. Whether you are entering a trade or managing a losing position, the "easy" psychological choice is usually the wrong financial one.
The Breakout Dilemma
Buying a breakout is difficult. You are often purchasing at a local high, fearing a "fakeout" or a wick down. However, waiting for a pullback is equally difficult because strong trends often do not pull back deep enough to give you an entry. Traders must accept that they will either buy high and risk a drawdown, or wait and risk missing the move entirely. There is no risk-free entry.
Cutting Losers
One of the most dangerous habits in the current market is holding onto underperforming altcoins in the hopes of a recovery. The "sunk cost fallacy" paralyzes traders, preventing them from rotating capital into assets that are actually moving, like Bitcoin.
Altcoins generally follow one of three paths: they go to zero quickly, they bleed slowly into irrelevancy, or—in very rare cases—they succeed. The statistical probability of holding a long-term winner is low. Realizing a loss is painful, but holding a dying asset while the rest of the market rallies is a far greater opportunity cost.
Just because you're down on something cannot paralyze you in selling that something... If you stick with stuff too long or for bad reasons, you will sit through losing all your money.
Personal Updates and Market Outlook
Beyond the charts, life in New Zealand has brought a shift in perspective. The move away from the high-intensity time zone of Europe has necessitated a transition toward high-timeframe trading. The focus has shifted from scalping low-timeframe volatility to positioning for longer-term moves, utilizing traditional finance vehicles for exposure where possible.
As we look toward the monthly close, the strategy remains cautiously optimistic. If Bitcoin can maintain its footing above the weekly resistance, we may see a push toward new all-time highs later this year. However, if the breakout fails and price falls back into the range, the outlook would turn bearish quickly. In this market, flexibility is not just an asset—it is a requirement for survival.
Conclusion
The market is currently offering a "secondary breakout" setup. After an initial failed breakout attempt, the price held the range midpoint and is now pushing back up—a sequence that often leads to a genuine impulse move. While the macro environment and monthly resistance provide reasons to be careful, the price action on the weekly chart suggests buyers are stepping in.
For traders, the task is to shed emotional attachments to underperforming bags, focus on assets showing relative strength, and be prepared to execute on uncomfortable setups. The "duck" is back, and the market appears ready to make a move.
![CAUTION: This Bitcoin TRAP Is Almost Set! [How I’m Playing It]](/content/images/size/w1304/format/webp/2026/03/bitcoin-price-trap-warning-market-analysis.jpg)

