
Table of Contents
In the world of proprietary trading, not all setups are created equal. While trend-following strategies provide consistent base hits, there is one specific setup that has generated more profit for our desk than any other: the parabolic, overextended short. This is the strategy that makes our firm millions when outlier events occur.
However, spotting the top of a parabolic move is notoriously difficult. Many traders attempt to short early, getting run over by "irrational exuberance" before the stock finally cracks. To solve this, we rely on the Relative Strength Index (RSI)—but not the way most retail traders use it. By customizing the settings and applying a rigorous multi-timeframe analysis, we transform a standard indicator into a precision tool for identifying unsustainable acceleration.
Here is how we trade the most profitable mean reversion strategy on our desk.
Key Takeaways
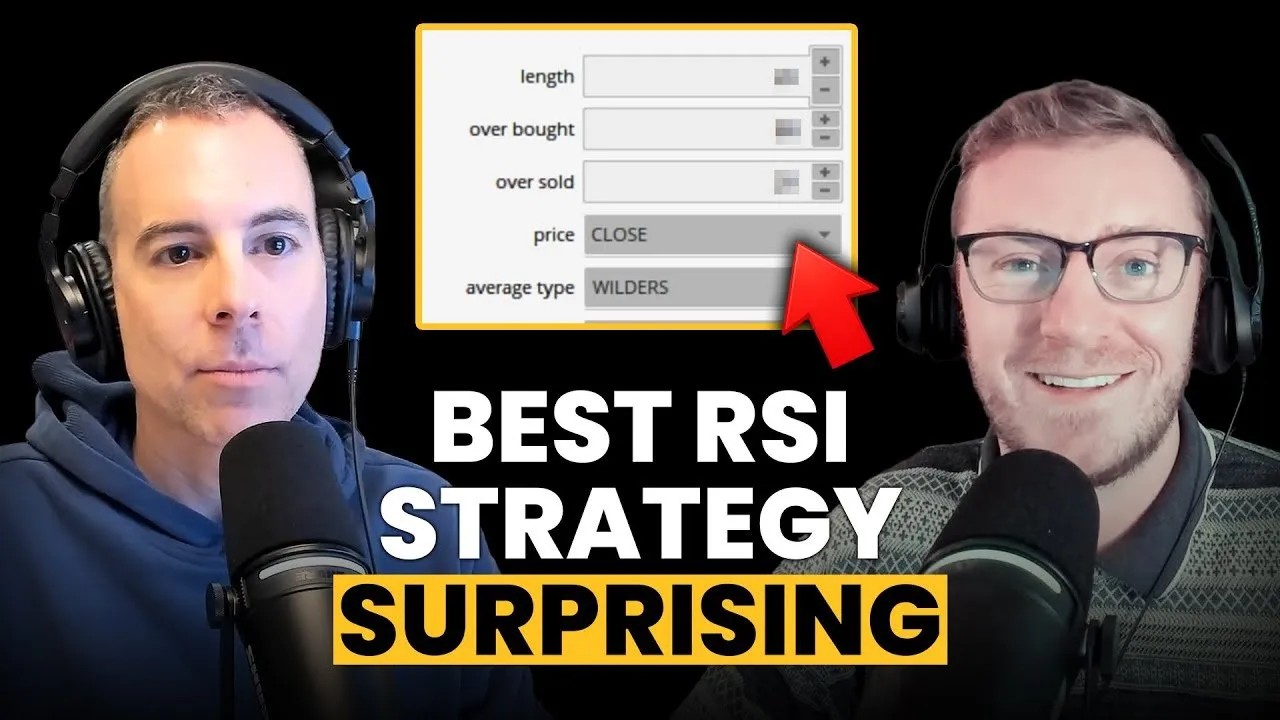
- Customize Your RSI Settings: Standard settings (14 period, 70/30) create too much noise. We adjust to a 20 period with 80/20 thresholds to isolate extreme outlier events.
- Demand Multi-Timeframe Alignment: A signal on the Daily chart is not enough. We require the RSI to be overbought simultaneously on the Daily, Intermediate (130-minute), and Short-term (30-minute) charts.
- Look for Acceleration, Not Just Price: The goal is to identify when a trend speeds up parabolically. Alignment across timeframes confirms that velocity is increasing, indicating a "blow-off" top is near.
- Context is King: Indicators are just math. They must be supported by "checks in favor," such as gap-ups, consecutive green days, and volume exhaustion.
The Anatomy of the Parabolic Short
This strategy falls strictly under the mean reversion playbook. We are looking for a stock or commodity that has become so extraordinarily extended on multiple timeframes that the move is mathematically and psychologically unsustainable. A common analogy used on our trading desk is that of a rubber band: you can only stretch it so far before it inevitably snaps back.
This is distinct from a standard uptrend. If a stock is grinding higher in a linear fashion, it is simply "price accepting." Shorting a strong trend is a recipe for disaster. We are specifically hunting for acceleration—moments where euphoria takes over, shorts are blown out, and the price goes vertical.
"We are looking for a devious child that's going to get kicked out of the kindergarten class. We need to change our settings to describe that deviant child."
Whether it is a commodity like Silver (SLV) driven by macro factors, or a "broken" stock like Beyond Meat driven by a liquidity trap, the technical dynamics of the blow-off top remain remarkably similar.
Why Default RSI Settings Fail
The vast majority of traders use the default RSI settings provided by their charting platforms: a 14-period lookback with overbought/oversold thresholds at 70 and 30. For standard market behavior, these settings are functional. However, for the A+ outlier trades we target, these defaults are dangerous.
When a stock enters a parabolic run, a standard 14-period RSI will scream "overbought" (above 70) far too early. If you short the moment a strong stock hits 70 RSI, you will likely be shorting the "front side" of the move, leading to repeated stop-outs as the stock continues to rip higher.
The Winning Customization
To filter out noise and identify true extremes, we make two critical adjustments:
- Period Length: We increase the lookback from 14 to 20. This smooths the data and requires a more sustained move to reach extreme readings.
- Thresholds: We widen the goalposts to 80 and 20. We are not interested in "normal" overbought conditions; we want to see the indicator hit 80 to signal a rare statistical anomaly.
By making these adjustments, we receive fewer signals, but the signals we do receive carry significantly higher conviction. We are filtering for the rarest opportunities that offer the best risk-to-reward ratios.
The Power of Multi-Timeframe Alignment
A high RSI on a daily chart alone is not enough to trigger a trade. The "secret sauce" of this strategy is the alignment of the RSI signal across three distinct timeframes. This confirms that the asset is overextended from a macro perspective and is accelerating on a micro perspective.
We look for the custom RSI (20 period, >80 threshold) to light up simultaneously on:
- The Daily Chart: Establishes the macro overextension.
- The Intermediate Chart (130-minute or 65-minute): Bridges the gap between the daily trend and intraday action.
- The Short-Term Chart (30-minute): Confirms immediate parabolic acceleration.
When all three timeframes hit the >80 threshold at the same time, it indicates that the trend is speeding up across the board. This specific alignment often coincides with the "blow-off" phase where the final buyers are exhausted, and the rubber band is stretched to its breaking point.
"It's not just the RSI signal on the daily. It's the RSI signal on the daily, plus some intermediate timeframe... and then on a shorter timeframe. We want to see these signals line up across time frames."
Context: The "Checks in Favor"
While the RSI provides the signal, the context provides the conviction. We treat indicators as tools to describe variables, not as rigid rules. Before executing a short, we stack "checks in favor" to increase the Expected Value (EV) of the trade.
We look for the following contextual clues to validate the RSI signal:
- Gap Ups: A gap up after a multi-day run is a classic sign of exhaustion. If a stock is already extended and gaps up into the open, it forces longs to take profit and traps late buyers.
- Consecutive Days Up: We want to see a stock that has been green for 3, 4, or 5 days in a row without a pullback.
- Extension from Moving Averages: Is the price significantly detached from the 5-day or 10-day moving average?
- The "Eye Test": Does the chart look vertical? Is the slope of the trendline becoming nearly 90 degrees?
Execution and Risk Management
Even with the perfect RSI alignment, we do not simply place a limit order and hope. We wait for price action to confirm the reversal. This might be an Opening Range Breakdown or a failure to hold a new high.
The risk with parabolic shorts is that "irrational" moves can last longer than you expect. You might try the trade and be wrong. If the price reclaims the highs after you enter, you must exit. Stubbornness in this setup leads to blown accounts. However, because the setup targets extreme deviations, the snapback is often violent and profitable, making the risk-to-reward ratio highly favorable for disciplined traders.
Conclusion
This strategy does not appear every day. You may only see a true "three-timeframe RSI 80" setup once or twice a quarter. However, these rare moments are often where the year's profits are made. By customizing your indicators to filter out the noise and waiting for the "perfect storm" of acceleration and multi-timeframe alignment, you move from gambling on tops to executing a professional mean-reversion strategy.
To learn more about professional trading strategies and join our daily trader meetings, visit smbtradingfloor.com.


)