
Table of Contents
If you are waiting for a move to be obvious before you take a trade, you are almost certainly too late. In the high-stakes environment of active trading, being late doesn't just mean missing out on profit; it often means becoming the "exit liquidity" for smart money that entered days or weeks prior. While anyone can identify strength when a stock is already up 100%, the true edge lies in identifying power before the explosion occurs.
This pre-breakout signal is known as hidden relative strength. It is the quiet accumulation that occurs while the majority of the market is distracted by volatility. It is not glamorous, and it rarely makes headlines until the move is already underway. However, for traders seeking to anticipate breakouts rather than chase them, spotting this divergence is one of the most reliable methods for timing entry points and filtering high-quality watch lists.
Key Takeaways
- Definition of Hidden Strength: Hidden relative strength occurs when a stock resists selling pressure during a general market downturn, indicating underlying demand.
- Institutional Footprints: This phenomenon is often driven by large funds executing TWAP (Time Weighted Average Price) orders, absorbing liquidity even when the broader market is weak.
- The Volatility Problem: Standard relative strength charts can be misleading if they don't account for volatility; normalizing data using Average True Range (ATR) provides a clearer signal.
- Actionable Intelligence: Hidden strength is rarely a buy signal in isolation. Instead, it serves as a "ranking tool" to prioritize stocks for immediate observation once the market stabilizes.
Defining Hidden Relative Strength
When most traders discuss relative strength, they are referencing stocks that are visibly outperforming—equities that are green when the market is green, or perhaps leading a sector rally. While valuable, this form of strength is often obvious to the entire street. By the time a stock is up 10% on the day, the "cat is out of the bag."
Hidden relative strength is more subtle and, consequently, more actionable for anticipating moves. It is defined not by how high a stock goes on a green day, but by how little it drops on a red day. It involves comparing the price action of a specific asset against a benchmark, such as the SPY (S&P 500) or QQQ (Nasdaq-100), specifically during moments of market weakness.
The Institutional Driver
The mechanics behind this signal are rooted in institutional accumulation. Large firms cannot enter full positions in a single day without significantly distorting the price. If a fund wants to acquire a massive stake in a company like Tesla or Western Digital, they must spread their buying over time.
On days when the broad market suffers a sell-off, these institutions continue their accumulation programs. Their buying pressure acts as a floor, supporting the stock price even as the indices tumble. This creates a divergence: the market prints a large red candle, while the accumulated stock trades flat or closes slightly down.
It's the footprints of those institutions and it's really the market showing you its hand. The market having those down moves gives you an opportunity to see which stocks have bids in them.
Qualitative Detection: Reading the Tape
You do not always need complex algorithms to spot hidden relative strength; often, it is visible simply by observing price action during intraday volatility. The goal is to collect data points when the indices are under pressure.
Consider a scenario where the Nasdaq (QQQ) is down 2% on the session. A trader should scan for equities that are:
- Trading Green: Stocks that are positive on a day the market is down significantly.
- Trading Flat: Stocks that are down only marginally (e.g., 0.25%) compared to a 2–3% market drop.
- Resisting the Close: If the market sells off heavily into the closing bell but a specific stock holds its range or ticks higher, it indicates a dedicated bidder.
These qualitative observations serve as early warning signs. If a stock refuses to go down with the market, it implies that once the market pressure lifts, the stock is primed to outperform significantly. Swing traders often use market pullbacks specifically to build these lists, identifying the leaders of the next leg up before the market even finds its bottom.
Quantitative Measurement: The ATR Adjustment
While visual observation is effective, quantitative traders require a more precise measurement to filter noise. The traditional method of measuring relative strength involves a ratio chart (dividing the stock price by the index price). However, this method has a fatal flaw: it fails to normalize for volatility.
If a high-beta stock like Tesla moves 4% while the market moves 2%, a simple ratio might suggest Tesla is showing relative strength. In reality, if Tesla is naturally twice as volatile as the market, it is simply performing in line with its volatility profile. It isn't actually "stronger"; it's just more volatile.
Normalizing for Volatility
To identify true strength, traders can use an indicator that normalizes price moves using the Average True Range (ATR). This calculation adjusts the returns based on the typical volatility of the asset.
The process works as follows:
- Calculate the move of the stock for a specific period (bar).
- Divide that move by the stock's ATR to get a "normalized volatility move."
- Perform the same calculation for the benchmark index (e.g., QQQ).
- Subtract the normalized index move from the normalized stock move.
This creates a cumulative line that reveals whether a stock is outperforming the market relative to its own normal behavior. If the line is flat, the stock is moving exactly as expected relative to the market. If the line trends upward during a market consolidation, it mathematically proves that the stock is displaying abnormal strength.
Strategic Execution: From Watch List to Trade
Identifying hidden relative strength is not, in itself, a buy signal. Buying a stock simply because it is down less than the market on a red day can lead to losses if the market continues to correct. Instead, this metric is a tool for watch list prioritization.
The Setup Phase
When a stock displays hidden relative strength, it should move to the top of the watch list. The trader then waits for a specific technical trigger, such as:
- The Market Turn: When the broader indices find support and begin to bounce, the stocks that showed hidden strength during the drop are statistically likely to be the first to explode upward.
- The Breakout Level: Often, stocks showing hidden strength will consolidate just below a key resistance level (a "pink line" or breakout point). The relative strength suggests the stock is coiling for a move through that level.
It's not like I'm buying it on that little red day just because I saw hidden relative strength. But when I get that alert... it's just going to the top of my watch list the next day.
Case Study: SNDK Consolidation
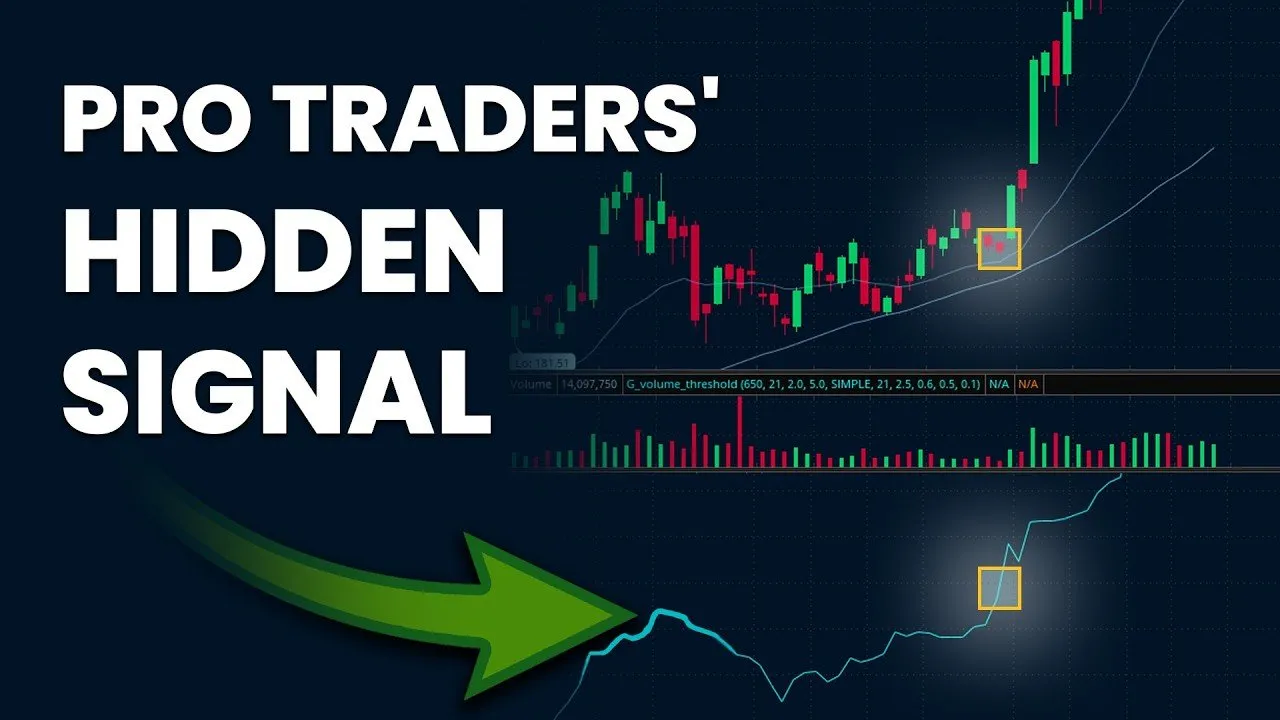
A notable example of this dynamic occurred with SNDK (SanDisk/Western Digital context) following a significant run-up. The stock entered a consolidation phase, pulling back from its highs. During this period, the market experienced a severe down day, closing at the lows. SNDK, however, printed a tight "doji" candle, barely moving despite the market turmoil.
While the stock wasn't green, the ATR-adjusted relative strength line broke out to new highs during that consolidation. This divergence signaled that while price was sideways, internal strength was building. Shortly after, when the market stabilized, SNDK reclaimed its trend and broke out through its resistance levels.
Conclusion
Trading is often a battle for bandwidth. With thousands of stocks moving every day, the ability to filter noise and focus on the highest-probability setups is what separates retail traders from professionals. Hidden relative strength provides a fundamental and technical filter to identify where institutional money is hiding.
By observing what holds up when the market falls down, traders can build a roster of resilient stocks. These are not merely defensive plays; they are coiled springs waiting for the pressure of the general market to lift. Whether using a qualitative eye or a quantitative ATR-adjusted indicator, the goal remains the same: identify the footprints of the "hunters" before the move becomes obvious to the herd.


)