
Table of Contents
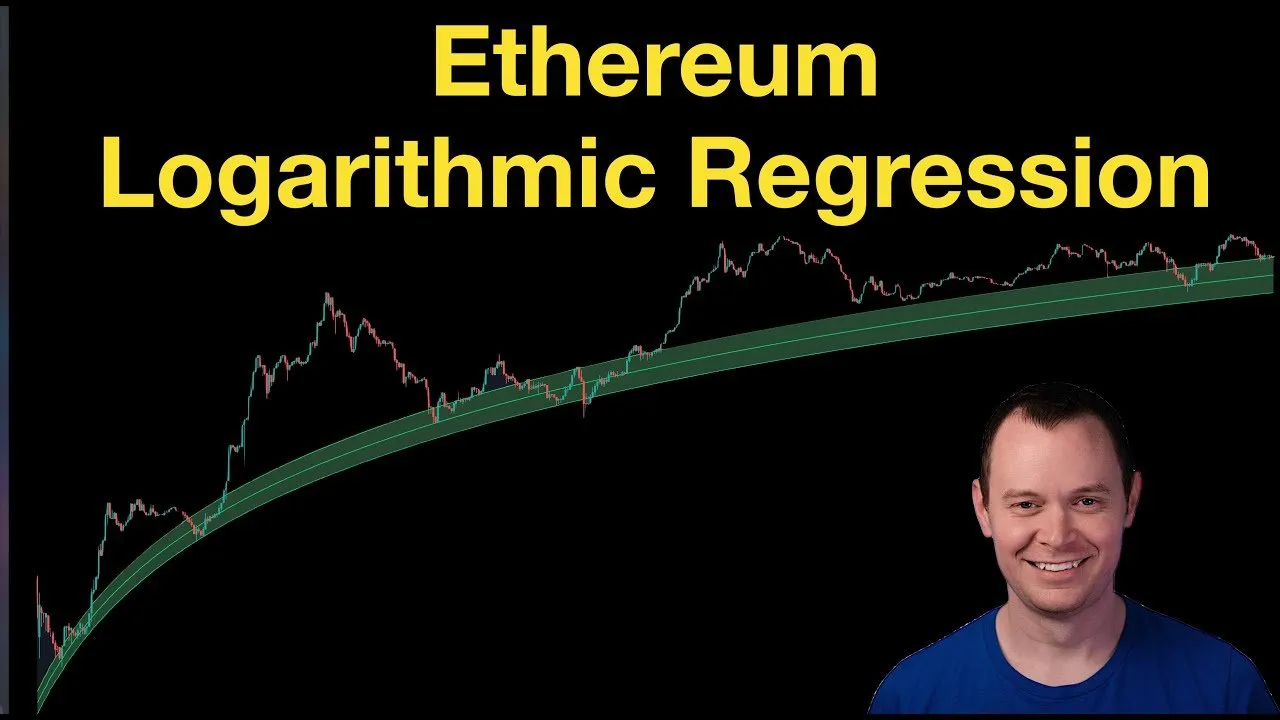
As the year draws to a close, it is often the perfect time to reflect on long-term market structures rather than daily volatility. For Ethereum, the journey since 2019 has been defined by a specific mathematical model: logarithmic regression. While market sentiment often shifts based on short-term news, the mathematical underpinnings of price action frequently tell a consistent, albeit sometimes uncomfortable, story. By revisiting the regression bands that successfully predicted the 2022 cycle lows, we can gain significant insight into where Ethereum is likely heading as we approach 2026.
Key Takeaways
- Historical Accuracy: The logarithmic regression model published in 2019 accurately predicted the Ethereum cycle lows in late 2022 around the $880 mark.
- The "Fair Value" Trajectory: The model suggests Ethereum’s "fair value" will align with the $2,100 price point by 2026, indicating a period of consolidation.
- Repeating Cycles: Current price action mirrors the 2019 pre-bull market phase, characterized by a slow bleed against Bitcoin and a return to the regression band.
- Macro Correlation: Ethereum’s movements correlate closely with Federal Reserve asset cycles, specifically the transition from Quantitative Tightening (QT) to Quantitative Easing (QE).
- Long-Term Outlook: A durable, multi-year bull market is projected to begin only after Ethereum has spent sufficient time consolidating within the regression band, likely moving into 2027.
The Legacy of the Logarithmic Regression Model
To understand where Ethereum is going, we must look at the track record of the logarithmic regression model. First published on the Into The Cryptoverse channel in 2019, this model was designed to filter out the noise of hype cycles and identify the asset's true trajectory. Back when Ethereum was trading near $100, the model speculated that the next major cyclical low—years into the future—would land around $800.
Remarkably, despite the massive volatility of the 2021 bull run, the 2022 bear market bottomed out at approximately $880. This validation suggests that while price can deviate wildly to the upside during mania phases, it eventually gravitates back to these mathematical bounds.
The regression band has been a pretty good indicator of actually identifying where the true fair value is. Whenever we get too elevated, we just go back down to it.
The core philosophy here is that Ethereum eventually "goes home." It returns to the regression band to build a sustainable foundation. While critics argue that the price stayed above the band for much of 2023 and 2024, closer inspection reveals this was largely due to Bitcoin’s strength pulling the market up, rather than organic Ethereum strength. This is evidenced by the consistent bleeding of the ETH/BTC valuation during that period.
Contextualizing Value: USD vs. Real Assets
One of the most deceptive aspects of the current market is the nominal price of Ethereum in US Dollars. Because fiat currency is inflationary—depreciating over time due to money printing—asset prices can appear to rise even when their purchasing power is stagnant or declining. To get a clearer picture of Ethereum’s strength, it is useful to measure it against assets other than the dollar, such as Silver or Bitcoin.
The Silver Comparison
When measuring Ethereum against Silver, the chart reveals a stark reality: valuations are already below the 2022 lows. Unlike the USD pair, which has maintained higher levels, the purchasing power of Ethereum relative to hard assets has degraded significantly. This divergence supports the theory that the asset is still in a corrective phase, regardless of what the fiat price tag suggests.
The Bitcoin Correlation
From late 2021 through 2025, holding Bitcoin was objectively the superior investment strategy compared to Ethereum. The "mantra" that Ethereum needs to return to its regression band implies that the ETH/BTC valuation must reset before a new era of outperformance can begin. Historically, Ethereum does not form durable cycle lows against Bitcoin until it has fully capitulated into its USD regression band.
The 2019 Parallel and Monetary Policy
History rarely repeats exactly, but it often rhymes. The current market structure bears a striking resemblance to 2019. During that cycle, Ethereum experienced a "relief rally" that many mistook for the start of a bull run, only to slowly bleed back down into the regression band as interest waned.
This behavior is deeply tied to macroeconomics, specifically the Federal Reserve's balance sheet:
- Quantitative Tightening (QT): As the Fed reduces its balance sheet, liquidity dries up, and risk assets like Ethereum struggle to maintain elevated valuations.
- Early Quantitative Easing (QE): We are currently in a phase where QE has technically begun, but it is in its infancy. In 2019, the initial switch to QE did not immediately trigger a bull run; instead, the market bled out until the liquidity injections became substantial.
The chart indicates that the extension from the regression band in 2025 matches the extension seen in 2019 almost perfectly. This suggests we are in a transition period—the "doldrums"—where patience is tested before the true liquidity cycle kicks in.
Projecting 2026: Consolidation and Fair Value
Looking ahead, the model points to a sober but necessary path for 2026. The regression band is slowly catching up to the price, effectively raising the "floor" of the asset. By early 2026, the model projects the fair value of Ethereum to be approximately $2,100.
For investors accustomed to all-time highs, a $2,100 target for 2026 may sound bearish. However, this level represents a healthy reset. It is the platform upon which the next bull market can be built.
I think Ethereum will spend some more time in this regression band in 2026... eventually we’ll come out of it and we’ll relive these glory days.
Why New Highs Now Could Be Bearish
Counter-intuitively, if Ethereum were to wick to a new all-time high immediately before entering the regression band, it could be detrimental to the long-term health of the cycle. A premature spike would likely be a "butterfly harmonic" pattern—a final exhaustion move usually accompanied by a lower high in the ETH/BTC pair. This would likely be followed by a severe crash.
A more constructive outcome is a slow, boring consolidation within the regression band throughout 2026. This washes out leverage, resets sentiment, and aligns the asset with the next wave of global liquidity expansion.
Conclusion
The logarithmic regression model forces us to look past the daily noise and accept that markets move in extended cycles. While the hope for an immediate "moon shot" is ever-present in crypto, the data suggests that Ethereum is currently in a phase of returning to fair value. This period of bleeding and consolidation, reminiscent of 2019, is likely the precursor to the next durable bull market.
For the long-term investor, 2026 appears to be a year of accumulation and patience. By understanding that the regression band must be tested and held, investors can better navigate the volatility, avoiding the trap of short-term euphoria and positioning themselves for the eventual expansion that historically follows these long periods of consolidation.


