
Table of Contents
Despite a bearish start to 2026 and a significant market correction throughout the previous year, key technical indicators suggest the cryptocurrency sector may be approaching a pivotal reversal. Market analysts are currently monitoring shifts in global liquidity, commodity ratios, and historical cycle patterns that mirror pre-bull run conditions seen in 2016 and 2020.
Key Points
- Global Liquidity Shift: A bullish crossover in US and Chinese 10-year Treasury yields suggests a transition toward cheaper global money, historically a catalyst for risk asset appreciation.
- Commodity Signals: The "Dr. Copper" to Gold ratio is breaking out, signaling potential economic expansion and an end to the current market downturn.
- Historical Cycles: Bitcoin is nearing the end of a typical 13-month underperformance period relative to gold, a pattern often followed by significant crypto market gains.
- Oversold Conditions: Weekly technical indicators show Bitcoin entering oversold territory for the first time since late 2024, presenting a potential accumulation zone.
Liquidity and Bond Yields Signal Turnaround
The primary driver for a potential market reversal lies in global liquidity trends, specifically the relationship between US and Chinese 10-year Treasury yields. Current charts indicate a "bullish stochastic RSI crossover" between these benchmarks. In financial markets, this technical signal often precedes a transition from high to low yields, resulting in increased global liquidity.
According to the analysis, similar crossovers occurred in August 2016, mid-2019, and mid-2023. In each instance, the crossover coincided with major upward movements in asset prices. The data suggests that as yields stabilize, capital may flow back into risk-on assets, providing the necessary support for a cryptocurrency market recovery.
"We're just going through a crisis of confidence currently. So, it's all about liquidity... [The crossover] signals a transition from high to low yields, cheaper global money, and more liquidity."
Commodities Point to Economic Expansion
Beyond bond markets, the relationship between copper and gold—often used as a barometer for global economic health—is flashing a recovery signal. Copper, essential for electronics and manufacturing, tends to rise during periods of economic expansion, while gold is traditionally held as a safe-haven asset during uncertainty.
The current "Copper-Gold Ratio" is bottoming out and beginning to rise. Historically, when this ratio breaks into expansion, it correlates with broader market rallies. For example, a similar breakout in 2016 coincided with Bitcoin’s ascent from approximately $500 to $20,000. A comparable breakout occurred alongside the market explosion in 2020. Analysts note that while gold prices are correcting, copper prices and miners are gaining traction, suggesting a shift toward growth-focused investments.
Bitcoin Technicals and Cycle Timing
For investors focused specifically on digital assets, the comparison between Bitcoin and Gold reveals a consistent cyclical pattern. Data indicates that Bitcoin typically underperforms gold during a "bear market" phase that lasts approximately 13 months on average. Following this drawdown period, Bitcoin historically decouples and significantly outperforms the precious metal.
Furthermore, pure technical analysis of the Bitcoin weekly chart shows the asset approaching oversold territory. The market has not seen an overbought Relative Strength Index (RSI) reading since late 2024. following a market peak of $126,000 in October of that year. Since the bearish MACD crossover in August, the market has been in a sustained downtrend. However, these depressed levels often present long-term accumulation opportunities for diversified investors.
Market Outlook and Strategy
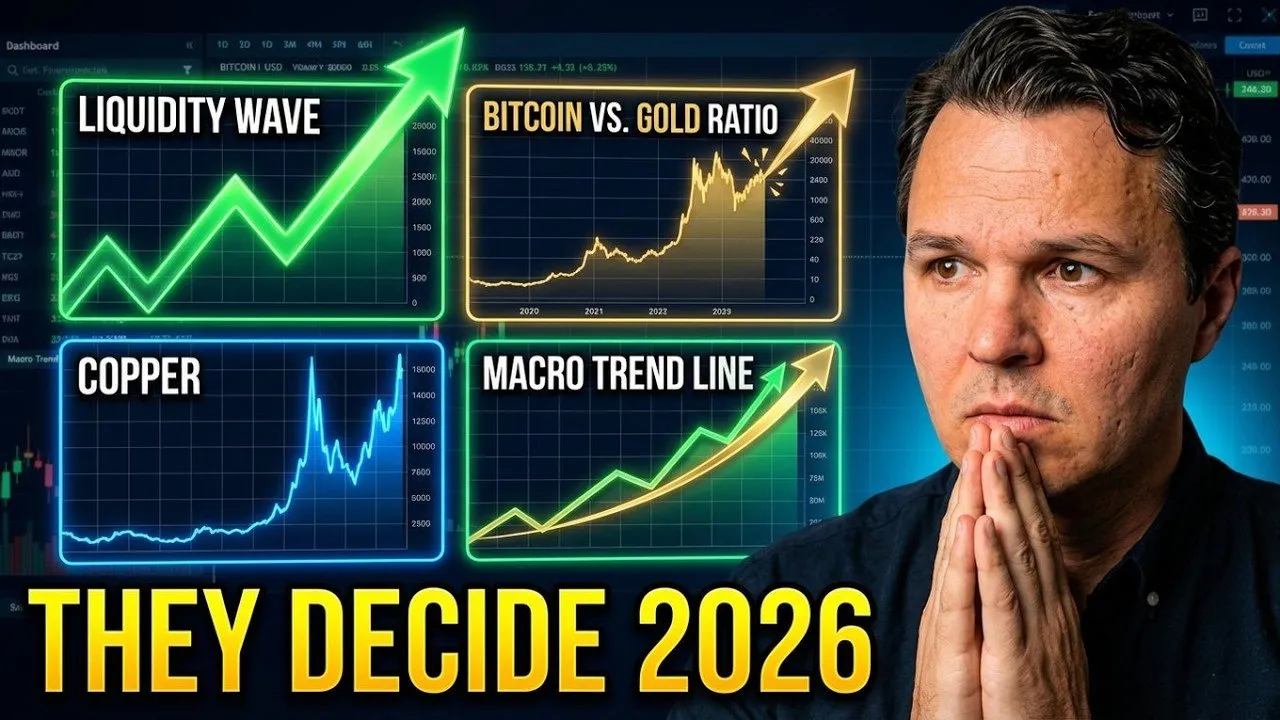
While current sentiment remains low due to recent price performance, the convergence of these four charts—bond yields, the copper-gold ratio, bitcoin-gold cycles, and weekly RSI levels—presents a strong case for a market floor.
Investors are advised to maintain a diversified portfolio that includes stocks and metals while utilizing dollar-cost averaging for digital assets during this accumulation phase. As 2026 progresses, the market expects a liquidity-driven reversal that could validate the long-term growth thesis for cryptocurrencies.


