
Table of Contents
HODL wave analysis exposes the predictable behavioral patterns that separate successful Bitcoin investors from perpetual bag holders.
Key Takeaways
- HODL waves track the percentage of Bitcoin supply held for different time periods, revealing investor behavior patterns
- Short-term holders (less than 6 months) consistently buy during mania phases and sell during downturns
- Long-term holders accumulate during bear markets when others are capitulating, then sell during bull runs
- Current data shows short-term holders losing faith again in summer 2025, similar to patterns seen in 2024
- Long-term holder percentage is spiking currently, though not yet at 2024 peak levels
- Major short-term holder peaks coincide almost perfectly with Bitcoin price peaks throughout history
- The cycle repeats predictably: accumulation by patient holders, distribution to FOMO buyers, capitulation, repeat
- On-chain data doesn't lie about selling behavior, regardless of what investors claim about "never selling"
- Tool reveals similar patterns exist across other cryptocurrencies like Ethereum, though less pronounced
- Understanding these patterns helps investors position themselves as accumulators rather than bag holders
The Brutal Truth About Who Actually Sells Bitcoin
Here's something that's going to make a lot of Bitcoin maximalists uncomfortable: the on-chain data reveals that pretty much everyone sells, regardless of what they say on social media. HODL wave analysis strips away all the rhetoric and shows exactly what people are actually doing with their Bitcoin, not what they claim they're doing.
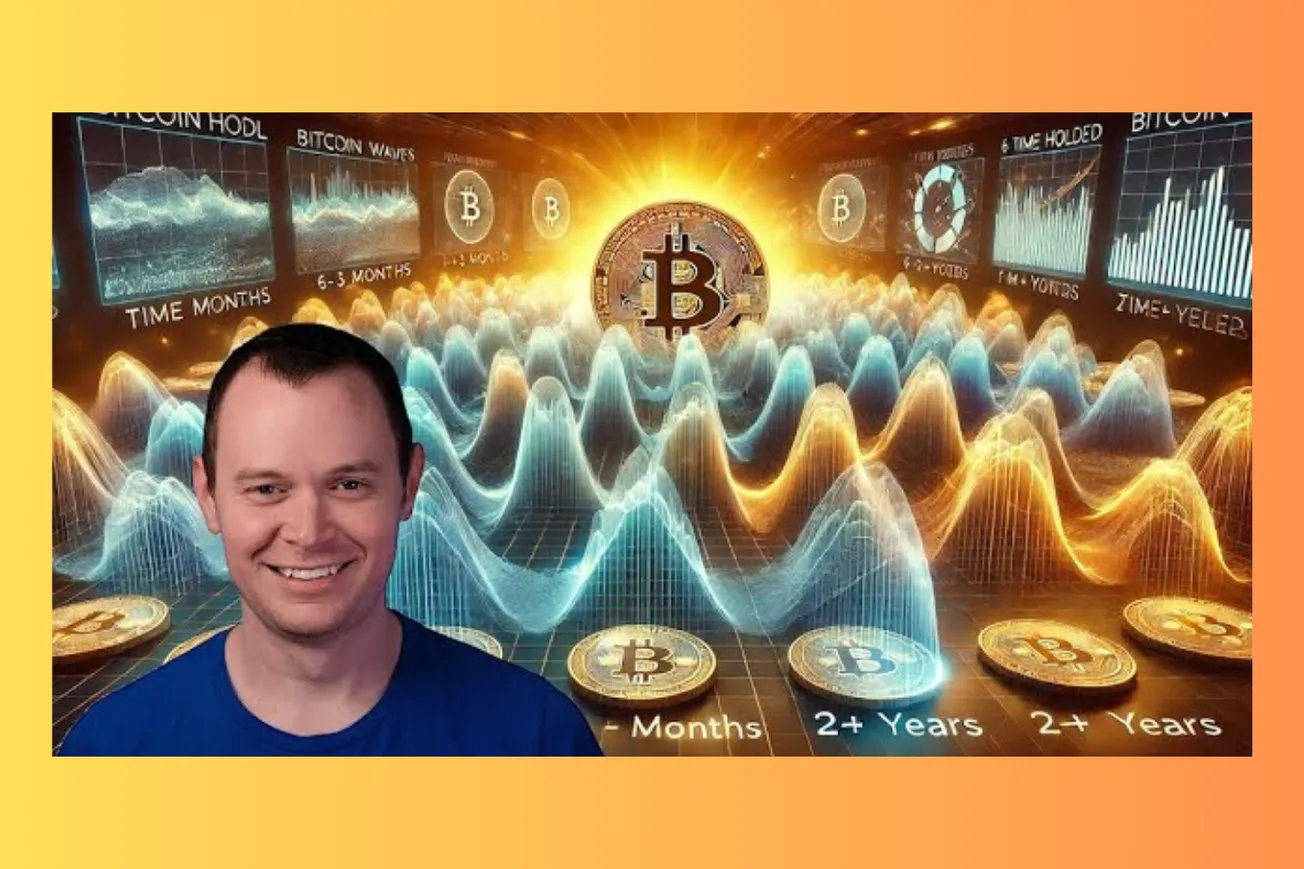
HODL waves measure the percentage of Bitcoin supply that hasn't moved in transactions for specific time periods. It's basically a way to see how long people have been holding their Bitcoin before they decide to move it. What this reveals about investor behavior is honestly fascinating and a little depressing if you've ever been caught in the wrong part of the cycle.
The data breaks holders into two main categories: short-term holders (less than 6 months) and long-term holders (6+ months). What you discover when you look at these patterns over multiple cycles is that human behavior is remarkably predictable, even in something as seemingly chaotic as cryptocurrency markets.
Short-term holders represent the classic retail FOMO crowd. They show up during mania phases when Bitcoin is making headlines and everyone's talking about it going to the moon. But here's the kicker - they're also the first to panic and sell when the excitement dies down and prices start dropping.
- Short-term holders consistently enter markets during peak euphoria and exit during fear phases
- Long-term holders demonstrate inverse behavior, accumulating during downturns and distributing during rallies
- On-chain data provides objective evidence of selling patterns regardless of social media claims
- Current summer 2025 data shows short-term holders losing faith, mirroring 2024 patterns
What makes this particularly brutal is how consistent these patterns are across every single Bitcoin cycle. You can literally see the waves of retail investors flooding in at the worst possible times and fleeing at the best possible buying opportunities. It's like watching the same movie over and over again, but with different actors playing the same roles.
The long-term holders are the ones who've figured out the game. They accumulate when prices are boring and nobody cares about Bitcoin. They sit through 60-70% drawdowns without flinching. They wait patiently for months or years. And then, when the bull market finally arrives and they're sitting on massive profits, guess what they do? They sell to the short-term holders who are just discovering Bitcoin.
The Summer 2025 Pattern That's Repeating History
Right now, we're seeing something really interesting play out in the HODL wave data that mirrors what happened in summer 2024. Short-term holders are starting to lose faith again, which is actually a pretty bullish signal if you understand what it means in the context of market cycles.
When short-term holders capitulate, it creates opportunities for long-term holders to accumulate. The data shows that long-term holder percentage is currently spiking, though it hasn't reached the same levels we saw back in October 2024. That earlier spike preceded a significant rally, which suggests the current accumulation phase could be setting up something similar.
What's particularly fascinating is how predictable this timing has become. Summer periods often coincide with reduced interest in crypto markets. Traditional finance people are on vacation, retail investors get distracted by other things, and the general hype around Bitcoin tends to die down. This creates perfect conditions for patient accumulation by those who understand the cycles.
The pattern is almost mechanical in its precision. Short-term holders come in during the exciting times, get bored when things quiet down, sell their positions, and those positions get absorbed by long-term holders who are thinking in much longer timeframes.
- Summer 2025 short-term holder capitulation mirrors 2024 patterns that preceded significant rallies
- Long-term holder accumulation is currently spiking but hasn't reached previous peak levels yet
- Seasonal patterns show summer periods often create optimal accumulation conditions
- Historical precedent suggests current accumulation phase may be setting up for future rallies
What's really interesting is that we can track this in real-time. You don't have to guess about market sentiment or try to interpret social media sentiment. The blockchain tells you exactly what's happening with holder behavior, and right now it's telling a pretty clear story about who's buying and who's selling.
The fact that long-term holders are accumulating while short-term holders are capitulating suggests we might be in one of those periods where the smart money is positioning for the next cycle while retail investors are getting discouraged and leaving the market.
Why Every Bitcoin Peak Looks Exactly the Same
One of the most striking things about HODL wave analysis is how clearly it shows that every major Bitcoin peak follows the exact same pattern. Short-term holder percentages spike dramatically right around price peaks, and it's not a coincidence - it's the fundamental dynamic that creates those peaks in the first place.
Think about what's actually happening during these mania phases. Long-term holders who have been accumulating for months or years finally see their positions moving into serious profit territory. At the same time, mainstream media starts covering Bitcoin, retail investors start paying attention, and FOMO kicks in hard.
The long-term holders, being rational actors who understand market cycles, start taking profits and selling to the incoming wave of retail buyers. These new buyers become the short-term holders who show up in the data right around market peaks. It's a perfectly logical transfer of Bitcoin from patient hands to impatient hands.
What makes this particularly predictable is that it happens every single cycle. You can literally overlay the short-term holder percentage spikes with Bitcoin price charts and they align almost perfectly. Major peaks in 2017, 2021, and other significant rallies all show the same pattern of short-term holder accumulation right at the top.
- Short-term holder percentage spikes align precisely with major Bitcoin price peaks across all cycles
- Long-term holders systematically distribute to incoming retail buyers during mania phases
- Media coverage and FOMO create predictable waves of new market participants at cycle tops
- The transfer from patient to impatient hands is a fundamental driver of market cycles
This isn't some abstract market theory - it's measurable, repeatable behavior that shows up in the blockchain data every single time. The people who have been holding Bitcoin through bear markets and accumulating during quiet periods are the ones taking profits from people who just discovered Bitcoin during the exciting times.
The tragedy is that most of the short-term holders could become long-term holders if they just had better timing and more patience. Instead, they end up buying high, getting scared during the inevitable corrections, and selling at exactly the wrong time.
The Psychological Profile of Long-Term vs Short-Term Holders
What HODL wave analysis really reveals is two completely different psychological profiles operating in the same market. Understanding these differences is crucial for anyone who wants to position themselves on the right side of market cycles.
Short-term holders are driven by excitement and fear. They show up when Bitcoin is exciting - when it's making new highs, getting media coverage, and generating social media buzz. They're the people who heard about Bitcoin from a friend who made money, or saw it trending on Twitter, or read a mainstream article about cryptocurrency millionaires.
But excitement is a terrible foundation for long-term investing. When the excitement fades and Bitcoin enters one of its inevitable quiet periods or corrections, these holders get bored or scared. They don't have the conviction that comes from understanding Bitcoin's fundamentals or experiencing multiple cycles. So they sell, often at a loss.
Long-term holders operate with completely different psychology. They're accumulating when Bitcoin is boring, when nobody's talking about it, when prices have been flat or declining for months. They're not driven by excitement - they're driven by understanding market cycles and having conviction in Bitcoin's long-term value proposition.
- Short-term holders are excitement-driven, entering during hype and exiting during fear or boredom
- Long-term holders are conviction-driven, accumulating during quiet periods and distributing during mania
- Emotional decision-making versus systematic, cycle-aware positioning creates predictable patterns
- Success in Bitcoin markets correlates strongly with psychological discipline and timing patience
What's particularly revealing is how consistent these psychological patterns are across cycles. You might think that as Bitcoin matures and more people understand its cycles, these patterns would become less pronounced. But the data suggests that human nature doesn't change much - there's always a new wave of participants who haven't experienced full cycles yet.
The long-term holders have usually been through at least one complete cycle. They've experienced the euphoria of bull markets and the despair of bear markets. They understand that both are temporary phases in longer-term cycles. This experience gives them the psychological fortitude to act counter-cyclically.
The most successful Bitcoin investors seem to be those who can transition from short-term holder psychology to long-term holder psychology. That usually requires experiencing at least one full cycle and learning from the emotional whiplash of buying high and selling low.
How to Use HODL Waves for Better Investment Decisions
Understanding HODL wave patterns isn't just academic - it can actually help you make better investment decisions by showing you which side of the market cycle you're on and where the smart money is positioning.
When you see short-term holder percentages starting to decline and long-term holder percentages starting to increase, that's typically a signal that we're entering an accumulation phase. This doesn't mean prices will immediately go up, but it suggests that patient capital is building positions while impatient capital is exiting.
Conversely, when short-term holder percentages start spiking rapidly, especially if they reach levels seen at previous cycle peaks, that's often a signal that we're entering a distribution phase where long-term holders are taking profits and selling to incoming retail buyers.
The key insight is that you want to be accumulating when long-term holders are accumulating, not when short-term holders are piling in. This requires developing the psychological discipline to be interested in Bitcoin when it's boring and to be cautious when it's exciting.
- Rising long-term holder percentages signal accumulation phases and potential buying opportunities
- Spiking short-term holder percentages often coincide with distribution phases and cycle peaks
- Counter-cyclical positioning aligns with successful long-term holder behavior patterns
- Timing decisions based on holder behavior rather than price action can improve entry and exit points
Current data showing short-term holders losing faith while long-term holders accumulate suggests we might be in one of those optimal accumulation phases. Of course, this doesn't guarantee immediate price appreciation, but it does suggest that patient capital is positioning for future cycles.
The tool also works for other cryptocurrencies like Ethereum, though the patterns tend to be less pronounced than with Bitcoin. This probably reflects Bitcoin's longer history and more established cycle patterns compared to other cryptocurrencies.
One practical application is using HODL wave data to inform position sizing. During periods when long-term holders are accumulating, it might make sense to be more aggressive about building positions. During periods when short-term holders are dominating, it might be better to be more conservative or even consider taking some profits.
The beauty of on-chain analysis is that it removes a lot of the guesswork from market timing. Instead of trying to interpret sentiment or guess about market psychology, you can see exactly what different types of holders are actually doing with their Bitcoin.
The Ethereum Comparison and What It Reveals
While Bitcoin's HODL wave patterns are well-established and pronounced, looking at the same data for Ethereum reveals some interesting differences that highlight Bitcoin's unique position in cryptocurrency markets.
Ethereum's HODL wave patterns are present but much less dramatic than Bitcoin's. The short-term and long-term holder dynamics exist, but they don't show the same extreme swings that characterize Bitcoin cycles. This probably reflects several factors that distinguish Ethereum from Bitcoin as an asset.
First, Ethereum has a shorter price history, so there are fewer complete cycles to establish clear patterns. Second, Ethereum serves different use cases beyond just store of value - it's actively used for DeFi, NFTs, and other applications that create different holding patterns. People might hold ETH for utility reasons rather than just investment reasons.
Third, Ethereum's supply dynamics are different due to staking and the transition to proof-of-stake. When ETH is staked, it's locked up for extended periods, which affects the HODL wave analysis in ways that don't apply to Bitcoin.
- Ethereum HODL waves show similar but less pronounced patterns compared to Bitcoin
- Shorter price history provides fewer complete cycles for pattern establishment
- Utility-driven holding versus pure investment holding creates different behavioral dynamics
- Staking mechanisms lock up supply in ways that affect traditional HODL wave analysis
What's interesting is that the basic pattern still exists - you can still see periods where short-term holders accumulate during price rallies and long-term holders accumulate during quieter periods. But the signals aren't as clear or as extreme as they are with Bitcoin.
This reinforces Bitcoin's position as the primary cryptocurrency for cycle-based investing strategies. While other cryptocurrencies certainly have their own cycles and patterns, Bitcoin's HODL wave data provides the clearest and most reliable signals for understanding broader cryptocurrency market cycles.
For investors interested in altcoins, Bitcoin's HODL wave patterns can still be useful as a general indicator of cryptocurrency market conditions. When Bitcoin long-term holders are accumulating, it often coincides with good accumulation opportunities across the broader cryptocurrency market.
The takeaway is that while HODL wave analysis works for multiple cryptocurrencies, Bitcoin remains the gold standard for this type of behavioral analysis due to its longer history, clearer cycles, and more pronounced holder behavior patterns.


)