
Table of Contents
Global financial markets experienced significant volatility over the last 48 hours following comments made by Donald Trump at the World Economic Forum in Davos, leading analysts to urge caution before entering new positions in Bitcoin and cryptocurrencies. Despite a temporary price surge driven by geopolitical headlines regarding Greenland and EU tariffs, technical indicators suggest that both the S&P 500 and digital assets remain in a precarious position, with major resistance levels yet to be reclaimed.
Key Points
- Bitcoin Resistance: Analysts identify $92,559 as the critical price level Bitcoin must reclaim to invalidate current bearish patterns.
- Market Cap Hurdle: The total cryptocurrency market capitalization needs to recover the psychological threshold of $3.1 trillion to sustain an uptrend.
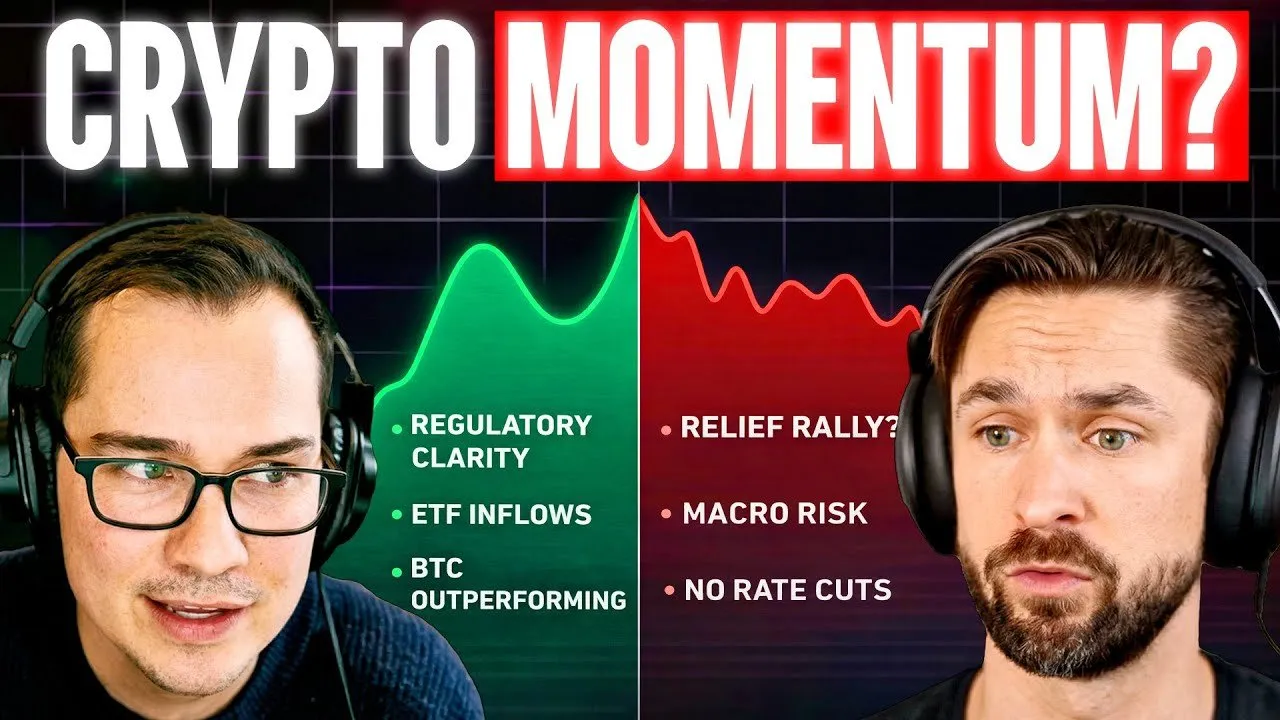
- Commodity Strength: While tech stocks and crypto struggle, commodities like Gold and Platinum are showing resilient bullish trends.
- Equities Correlation: The S&P 500 faces a pivotal test, needing to hold above 6,866 to prevent a deeper correction that would likely drag crypto markets lower.
Analyzing the "Trump Effect" and Volatility
The recent market movements have been characterized as a "whipsaw," with Bitcoin spiking by $2,000 before dropping $3,300, only to bounce back. This instability was largely triggered by reaction to political rhetoric from Davos, specifically regarding trade tariffs and geopolitical stances. However, market observers warn that price spikes driven purely by news events often lack sustainability if the underlying technical structure remains bearish.
According to the analysis, the market is currently in a "price action reading" phase. When news events push prices up but assets fail to maintain those levels, it often indicates underlying weakness. The primary reason cited for delaying Bitcoin purchases is the need to observe how the U.S. stock market opens and digests these developments. If the S&P 500 fails to break the 7,000 resistance level and instead falls below 6,866, the correlation between equities and crypto suggests digital assets will likely follow suit.
"When you see markets heavily affected by news, you have to do what is called 'reading price action.' When news events push price up... and the price can't hold those levels, that indicates the market is still heavy."
Critical Technical Levels: The $3.1 Trillion Barrier
Beyond external equities data, the cryptocurrency market faces internal hurdles. A major factor preventing a bullish outlook is the total crypto market capitalization, which sits below a critical 50% retracement level. Analysts point to $3.1 trillion as the line in the sand. This figure represents not only a psychological barrier but also the technical level required to recover the losses from the initial drop.
Furthermore, technical patterns on Bitcoin specifically remain concerning. The asset is currently trading within a "bear flag" formation. Unless bulls can push the price above $92,559—a level coinciding with the 50% Fibonacci retracement of the recent range—the bearish pattern remains valid and suggests a high probability of a break downward.
Sector Divergence: Commodities vs. Tech
While the outlook for cryptocurrencies and tech stocks like Apple and MicroStrategy remains mixed to bearish, commodities are emerging as a bright spot. Gold continues to form higher highs and higher lows on the 4-hour timeframe, indicating a sustained uptrend. Similarly, Platinum has shown resilience, bouncing off key moving averages and offering better risk-to-reward ratios for traders than the current crypto market.
In contrast, tech stocks appear vulnerable. MicroStrategy, often used as a proxy for Bitcoin exposure, has seen weak buy-side pressure, with rallies driven largely by news rather than organic volume. This divergence suggests capital may be rotating into safer, hard assets amidst the current uncertainty.
What to Watch Next
Traders should closely monitor the daily and weekly closes for Bitcoin. A failure to close above the monthly open could result in a "red month," historically a signal for further consolidation or downside in the range of $60,000 to $70,000. For the immediate future, the invalidation of the bear flag at $92,559 serves as the primary trigger for any shift in market sentiment from bearish to neutral.


